
Technical analysis · Beginner
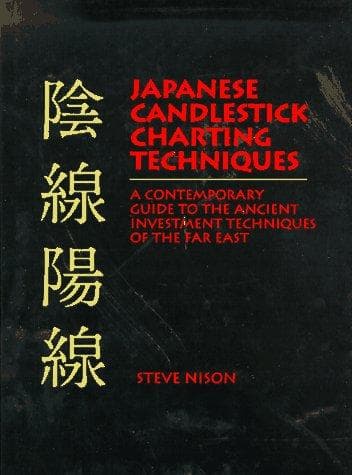
Japanese Candlestick Charting Techniques
Steve Nison
The book that brought candlesticks to the West. Read it once and the daily NEPSE price screen stops looking like noise.
Print-disabled only
A scan exists but access is limited to readers with a qualifying print disability. This book is still in copyright, so we cannot host it here.
- First published
- 1991
- Length
- 307 pages
- ISBN
- 9780139316500
The highlights
What this book actually gives you, in short.
- 1
Explains what each candle body and shadow actually records about the session's fight between buyers and sellers.
- 2
Covers the reversal patterns — hammer, engulfing, doji, star — with the context needed for each to mean anything.
- 3
Read it once and a NEPSE daily price screen stops looking like noise.
At a glance
Drawn from the catalogue record — every line here is a checkable fact about the book, not an opinion about it.
- Covers Investment analysis, Stocks, Charts, diagrams, etc, Charts, diagrams, Candle-stick-Chart.
- First published in 1991.
- About 307 pages, roughly 7 hours of reading.
- A scan exists but is restricted to readers with a qualifying print disability.
Catalogue details (publication year, length, ISBN and cover) were compiled once from Open Library and are stored on this site. The at-a-glance points are generated from that record. The numbered highlights are written by the Stock Education team. This page loads nothing from any other website.